Traffic Studies (November 9, 2009):
Traffic counts, modeling and projections do not give us a perfect picture of what the traffic will really do, but they usually come very close, so that we can predict with reasonable certainty how to best improve safety and accommodate the traffic volumes anticipated for the project area in the future.
Click on the graphics to download a more readable PDF file if you wish.
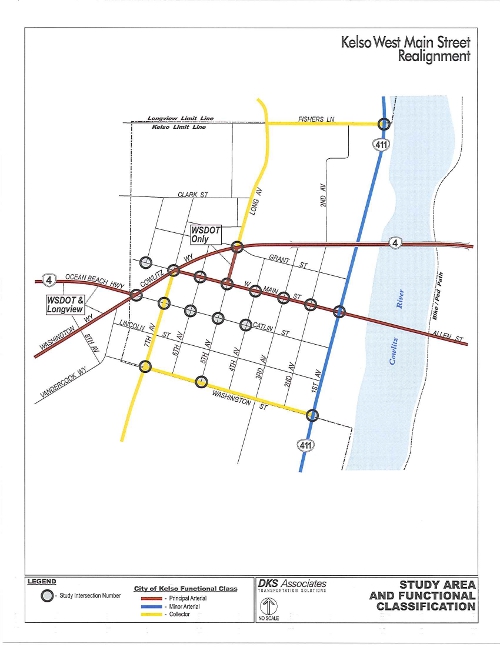
This Study Area and Function Classification graphic on the right shows the intersections included in the traffic study, and the classifications of the streets (how they are intended to be used) within the study area:
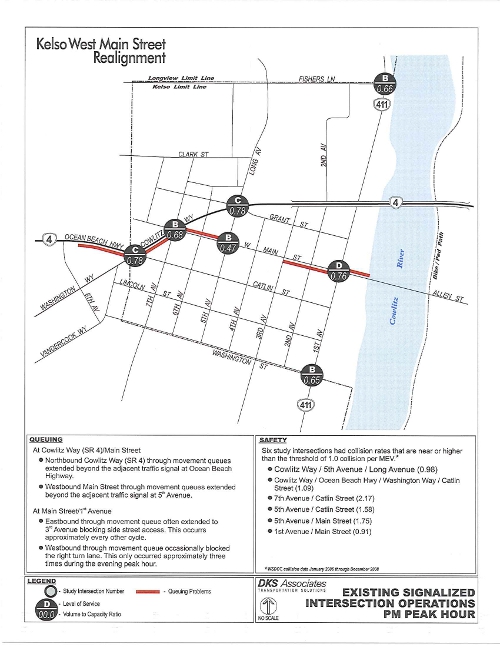
The Existing Signalized Intersection graphic below shows where traffic currently backs up (queuing), and where safety concerns exist during the afternoon peak traffic hour. Understanding these issues helps the design team find ways to minimize these impacts.
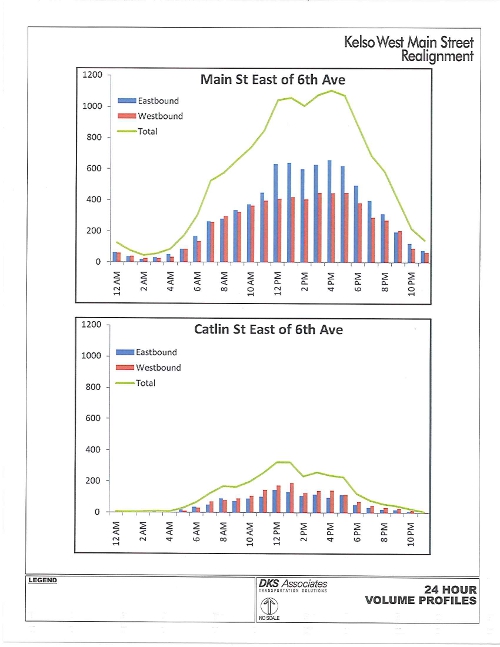
The last graphic, 24 hour Volume Profiles, shows how the traffic changes over an average 24 hour period, helping to understand when peak traffic occurs and for what length of time. That information is used to determine signalization and design considerations for the project.